When you migrate to SQL Server 2014, rather than turning on the new cardinality estimator right away, I recommend sticking with the old cardinality estimator initially by leaving your database in SQL Server 2012 compatibility mode. Let the database settle down for a few weeks, let folks air out their grievances, and give yourself some time to make sure the system is working at least as well as the old system.
Once you’re on 2014, you can check out the new CE’s execution plans by playing around with trace flag 2312. That flag turns on the new CE in one of two ways:
- At the query level using OPTION (QUERYTRACEON 2312), or
- At the session level using DBCC TRACEON(2312)
The latter is easier if you have to test a lot of queries at once, or if you need to test a stored procedure. Just turn on the trace flag, and it’s on for only your session.*
* – I lied. It’s not.
If you set trace flag 2312 for your session, and then run a stored procedure whose execution plan isn’t already cached, that stored procedure gets compiled using the new cardinality estimator, and the resulting plan is put into cache.
Subsequent sessions will use that plan even if they don’t have trace flag 2312 enabled.
Here’s how to prove it on a SQL Server 2014 server in a 2012 (or earlier) compat mode database:
- Pick a rarely-executed stored procedure. (If you’re doing this in production, don’t use a stored procedure that will cripple your server if it happens to get compiled with the 2014 CE.)
- Recompile it using sp_recompile ‘myprocname’.
- In a new SSMS window, run DBCC TRACEON(2312) to enable the new CE in your session.
- Click Query, Include Actual Query Plans.
- Execute the stored procedure.
- Right-click on the query plan and click Show Execution Plan XML.
- In the first few lines, look for the string “CardinalityEstimationModelVersion” – if it’s 120, that’s the new CE. 70 is the old one. You’ll see 120 as shown in the example below.
- Close that query window, and start a new one. Run DBCC TRACESTATUS to verify that you don’t get a line for 2312, indicating you’re still on the old CE.
- Make sure Query, Include Actual Query Plans is on.
- Execute the stored procedure again.
- Right-click on the query plan and click Show Execution Plan XML. Even though you’re in the old compat mode, you’ll be looking at a 120-level CE plan.
- Recompile that stored proc using sp_recompile ‘myprocname’ just to make sure it gets out of cache.
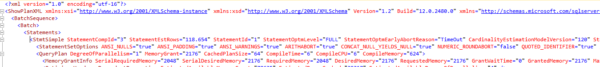
Execution plan XML – note the CardinalityEstimationModelVersion at the top right.
So how do you test stored procedures with the new CE?
You could test on a different server with the databases set to the new 2014 compatibility level, but of course when you’re testing execution plans and query performance, the servers need to be identical. That’s not always possible.
If you have to test both the old & new CEs on the same server, you’ll need to create new stored procedures (like myprocname_2014) with OPTION (QUERYTRACEON 2312) on every single query in the stored proc – or, at least, all of the queries where you’re concerned about performance variances.
Kendra says: Well, there’s always plan guides. Kidding! I’M JUST KIDDING!