Deadlocks are hard
Especially when there are a lot of them. When there are dozens or more, looking at each graph is a pain.
I had a script written that parsed out the XML, but really, having a folder full of random scripts is for old people.
Like Twitter and reverse mortgages.
So I turned it into a Stored Procedure, and added it to the FRK.
Notables
Right now, this proc is only compatible with SQL Server 2012+. Even though it’s possible to capture deadlocks in older versions via the System Health (or a custom) Extended Event session, it’s a different batch of XML. If anyone out there on an older version wants to add separate parsing, well, that’s the beauty of Open Source. Head on over to our GitHub repo to learn how to contribute.
With that out of the way, here are the current set of variables:
- @Top: Use if you want to limit the number of deadlocks to return. This is ordered by event date ascending
- @DatabaseName: If you want to filter to a specific database
- @StartDate: The date you want to start searching on.
- @EndDate: The date you want to stop searching on.
- @ObjectName: If you want to filter to a specific able. The object name has to be fully qualified ‘Database.Schema.Table’
- @StoredProcName: If you want to search for a single stored proc. The proc name has to be fully qualified ‘Database.Schema.Sproc’
- @AppName: If you want to filter to a specific application.
- @HostName: If you want to filter to a specific host.
- @LoginName: If you want to filter to a specific login.
- @EventSessionPath: If you want to point this at an XE session rather than the system health session.
Pretty standard stuff for a Blitz script! Note that by default we look at the System Health session for deadlocks.
If you have a custom session, use the path to the files for it like so: 'c:\temp\deadlocks*.xel'.
We can’t get any custom fields that you’ve added to a session. There didn’t seem to be a lot of joy in reverse engineering a session definition from the XE DMVs, and then constructing dynamic XQuery to parse it.
If you wanna spend your weekend on that hobby horse, well, prepare for some saddle sores.
Output
So what does running it get you?
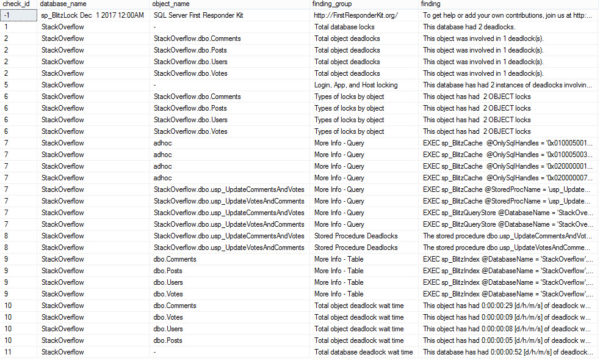
The first set of output looks like this:

Take 1
And scrolling right…

Take 2
Helpful stuff! This is all of what I’d consider useful information from the deadlock XML laid out in front of you.
And of course, we do high-level analysis of all the stuff we pull out.
Probably right!
The information in here can help you track down which tables and stored procs are involved in your deadlocks, and give you queries to get more information about them using our other scripts — sp_BlitzIndex for indexes and sp_BlitzCache/sp_BlitzQueryStore for queries/procs.
Support
If you run into any problems, please use GitHub for support. We can’t do troubleshooting via blog comments.
Thanks for reading!
Brent says: I already used this at a client and was absolutely dumbfounded by how much cool information it pulled back instantly. In less than one minute, we were able to see exactly which logins were causing the deadlocks, what code was at fault, and what index we needed to add. Good job, sir.
Are you being paid fairly? Let's find out: the 2018 Data Professional Salary Survey is open.