Your client or boss just said, “Find out why this SQL Server is slow.” You’ve already done a free SQL Server health check, and now you wanna investigate deeper.
Step 1: Download & run sp_BlitzFirst.
Start with wait stats, which tell you what the SQL Server has been waiting on since the service was last started, or since someone cleared wait stats with DBCC SQLPERF, whichever is more recent.
Go to our download page and get our First Responder Kit. There’s a bunch of scripts and white papers in there, but the one to start with is sp_BlitzFirst.sql. Open that in SSMS, run the script, and it will install sp_BlitzFirst in whatever database you’re in. (I usually put it in the master database, but you don’t have to – it works anywhere.)
Then, run sp_BlitzFirst with these options:
EXEC sp_BlitzFirst @SinceStartup = 1;
Here’s the first set of results:
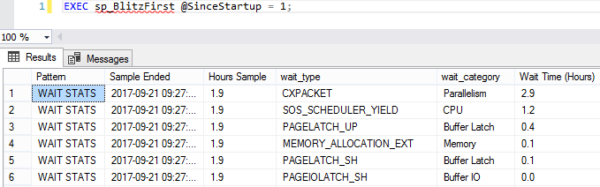
sp_BlitzFirst @SinceStartup = 1
We’re going to focus only on this first result set. It returns a lot of other stuff – for info on that, hit the documentation page.
This is a prioritized list of what your SQL Server queries have been waiting on – but it is indeed all queries since startup, which includes jobs like backups, index rebuilds, CHECKDB, etc. In a perfect world, you’d want to log it to a table, and trend it over time. There’s more info on how to do that on the documentation page, but for a quick performance check, we’re just going to start here.
Step 2: Review what your top wait type means.
Start with your top wait type, and work your way down. Here’s some common wait types and how to get more information about ’em:
- CXPACKET – parallelism, which isn’t necessarily bad
- PAGEIOLATCH% – waiting to read data pages from data files on disk (we didn’t have enough memory to cache them, or we have bad indexes, or bad queries, or slow storage, or all of the above)
- SOS_SCHEDULER_YIELD – queries need more CPU time (but doesn’t necessarily mean that the entire server is running 100% CPU, which makes things kinda tricky)
- WRITELOG – which is, uh, exactly what it sounds like
There are hundreds of wait types – way beyond what I can do justice to here – but usually you can Google your way through a lot of pages explaining what each wait type means.
Heads up, though: when you’re reading about a wait type, be aware that the page’s author may have an agenda. For example, if you read a page about PAGEIOLATCH written by a storage vendor, their primary goal may be telling you your storage is too slow, and you should invest in faster storage. They might be right – but try to find the queries causing the wait first, and see if you can tune those for free. (Your time, after all, is free. At least that’s what your boss told me.)
Step 3: Find the queries causing that wait type.
Run sp_BlitzCache, another script from our First Responder Kit that analyzes your plan cache to find your most resource-intensive queries. Here’s how:
EXEC sp_BlitzCache @SortOrder = 'cpu';
In that example, I’m sorting the plan cache to find the most CPU-intensive queries. You’ll want to use a sort order that matches up with your primary wait type – for example, if you’re waiting on PAGEIOLATCH (reading data pages from the data file), you’ll want to use @SortOrder = ‘reads’.
To get the full list of sort order options, plus all kinds of other stuff like explanations for what each column means, run:
EXEC sp_BlitzCache @Help = 1;
Here’s what the default sp_BlitzCache output looks like:

sp_BlitzTango’s partner
In the Query Type column, check out lines 1 & 2.
Line 1 is “Procedure or Function: GetCommentsDetails” – which means that this stored procedure overall is the top CPU-using query.
Line 2 is “Statement (parent: [dbo].[GetCommentsDetails]) – which means it’s a line inside GetCommentsDetails. This one line is our biggest CPU-using statement overall. If you were going to tune GetCommentsDetails, this is the line in the proc that you want to focus on.
Then, check out the Warnings column. sp_BlitzCache does all kinds of checks in the query plan’s XML to spot common issues like unparameterized queries, missing indexes, joining to user-defined-functions, low-cost-but-high-CPU plans, and much more. They’re not a final verdict – they’re just giving you tips on where to start with your investigation.
Step 4: Write up your analysis.
If you only have an hour, play mad libs:
Our SQL Server’s primary wait type is _____, which means we’re waiting on _____. To fix it, I recommend that we try to tune these 5 queries and the indexes they use:
-
_____
-
_____
-
_____
-
_____
-
_____
If you have a day, start doing preliminary investigations into those queries. Are they reasonable queries, things that the SQL Server’s hardware should be able to accomplish in a timely basis? Are they being called an appropriate number of times, or are they victims of an N+1 bug in the app code? Could they be fixed quickly with judicious indexing? Your goal in a day isn’t to fix them, but just to estimate time requirements. (Sometimes you actually can fix ’em – but set expectations, because query result sets need to be tested too.)
If you have a few days, and if you’re not allowed to change the code or indexes or server right away, then write up a more detailed overview. Tie the server’s health together by correlating the hardware performance levels, SQL Server’s top wait types, and the queries causing those waits. While you might be biased that there’s a single root cause – say, the application is garbage or the server is a Speak-n-Spell – there may still be multiple ways to fix it. For examples of that storytelling, check out the sample findings from our SQL Critical Care® process.
Our 3-day SQL Critical Care shows you why your SQL Server is so dang slow. See sample reports and book a call with us here.